

Back in 2023, we had an idea: build an analytics platform that treasurers could actually use without headaches. It needed to deliver real-time insights into key metrics like net cashflow, balances, and average transaction sizes, while being flexible enough to create dashboards tailored to every organization’s unique needs.
Our first attempt—fondly dubbed Naivety—was built on a single-threaded Go runtime that crunched data using basic computations. It worked... until it didn’t. As we started handling more data and onboarding more customers, the cracks showed. Scalability? Struggled. Latency? Painful. Reliability? Let’s just say there were a few late-night panic sessions.
This post is a deep dive into how we leveled up. We’ll walk through the evolution of our platform: from early attempts with a precompute layer to fully embracing ClickHouse for ultra-fast querying and real-time updates. It wasn’t all smooth sailing, but we came out with a system that can handle millions of transactions every minute and still feel lightning fast.
We set out to create an analytics platform that could deliver:
Our initial implementation, which we affectionately call "Naivety," was on a Go runtime. This module aggregated data using mathematical primitives and single threaded evaluations.
To achieve the above objectives, we developed a strategy centered around two core components: an Analytics Precompute Layer and a Widget Layer
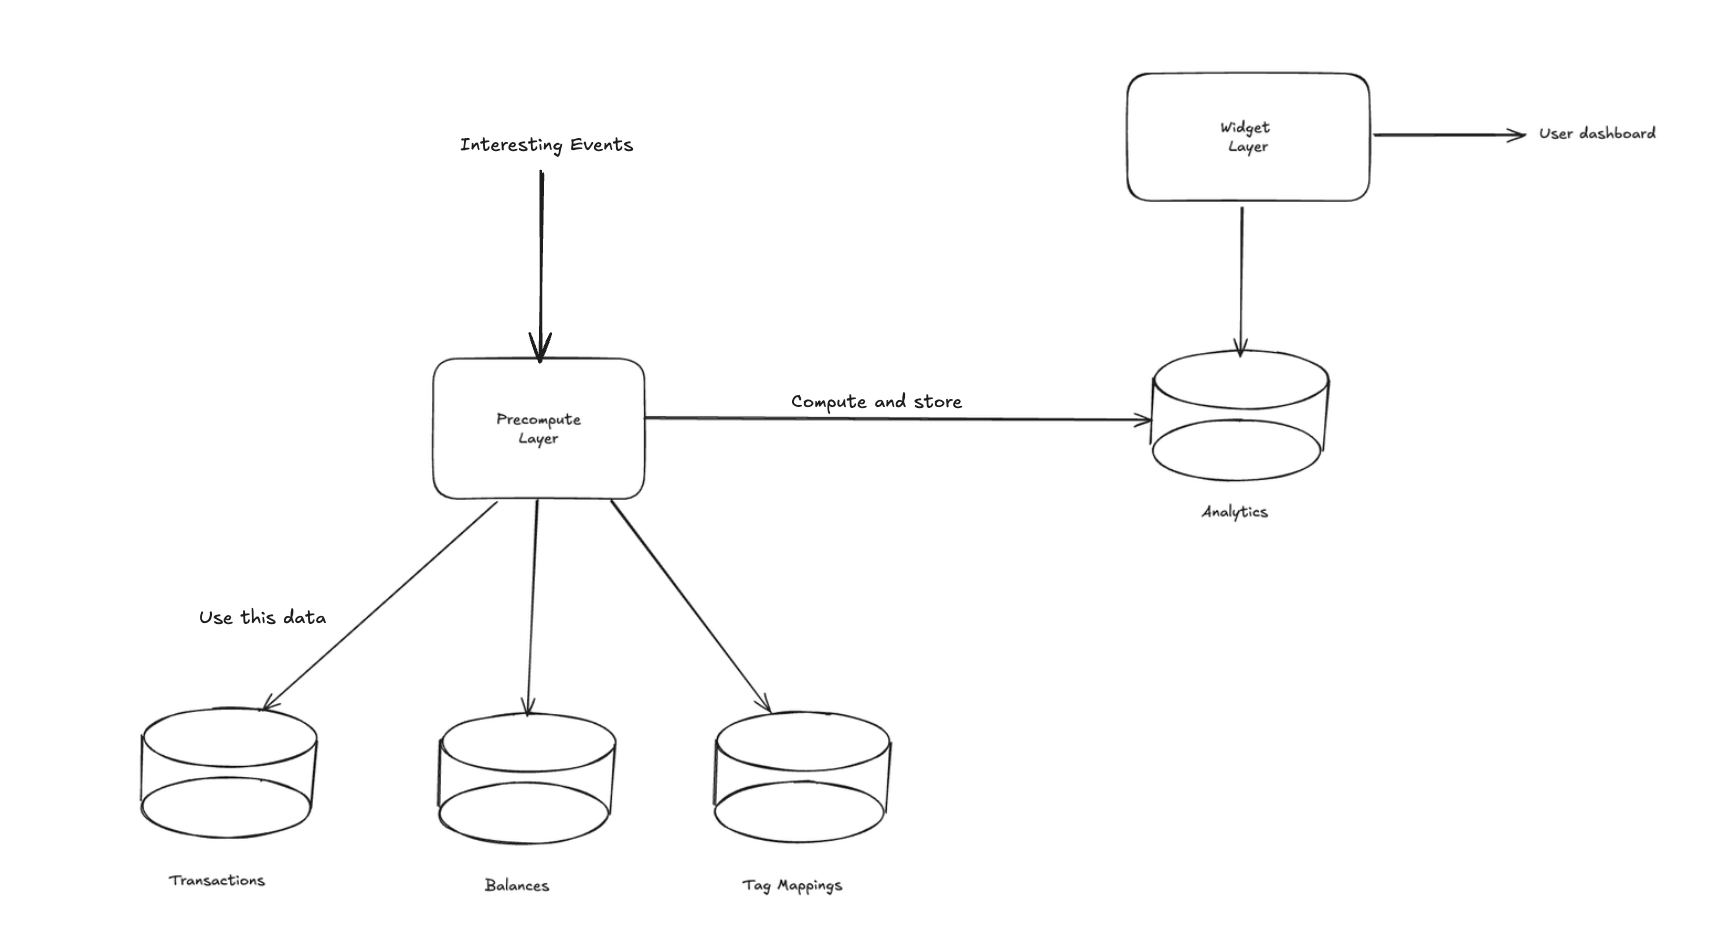
Precompute layer
This layer was designed to process every interesting event in our system, including when a new transaction gets ingested, a transaction is tagged and balances are updated from the banks.
The precompute layer's job was to stay current with all system events and perform necessary aggregations and computations.
func ComputeNetCashFlow(accountId string, date time.Time) (float64, error) {

    // Fetch transactions for the account and date
    transactions := GetTransactions(accountId, date)

    // Calculate net cash flow
    netCashFlow := 0.0
    for _, txn := range transactions {
        if txn.Type == "credit" {
            netCashFlow += txn.Amount
        } else if txn.Type == "debit" {
            netCashFlow -= txn.Amount
        }
    }

    return netCashFlow, nil
}
Simplified example of how "net cash flow" was calculated.
Widgets layer
We decoupled this layer from our analytics layer. Its sole responsibility was to query metrics from the precomputed analytics and transform them into a data format that our front-end could understand and display for each "component" as shown below.
func ComputeNetCashFlow(accountId string, date time.Time) (float64, error) {

    // Fetch transactions for the account and date
    transactions := GetTransactions(accountId, date)

    // Calculate net cash flow
    netCashFlow := 0.0
    for _, txn := range transactions {
        if txn.Type == "credit" {
            netCashFlow += txn.Amount
        } else if txn.Type == "debit" {
            netCashFlow -= txn.Amount
        }
    }

    return netCashFlow, nil
}
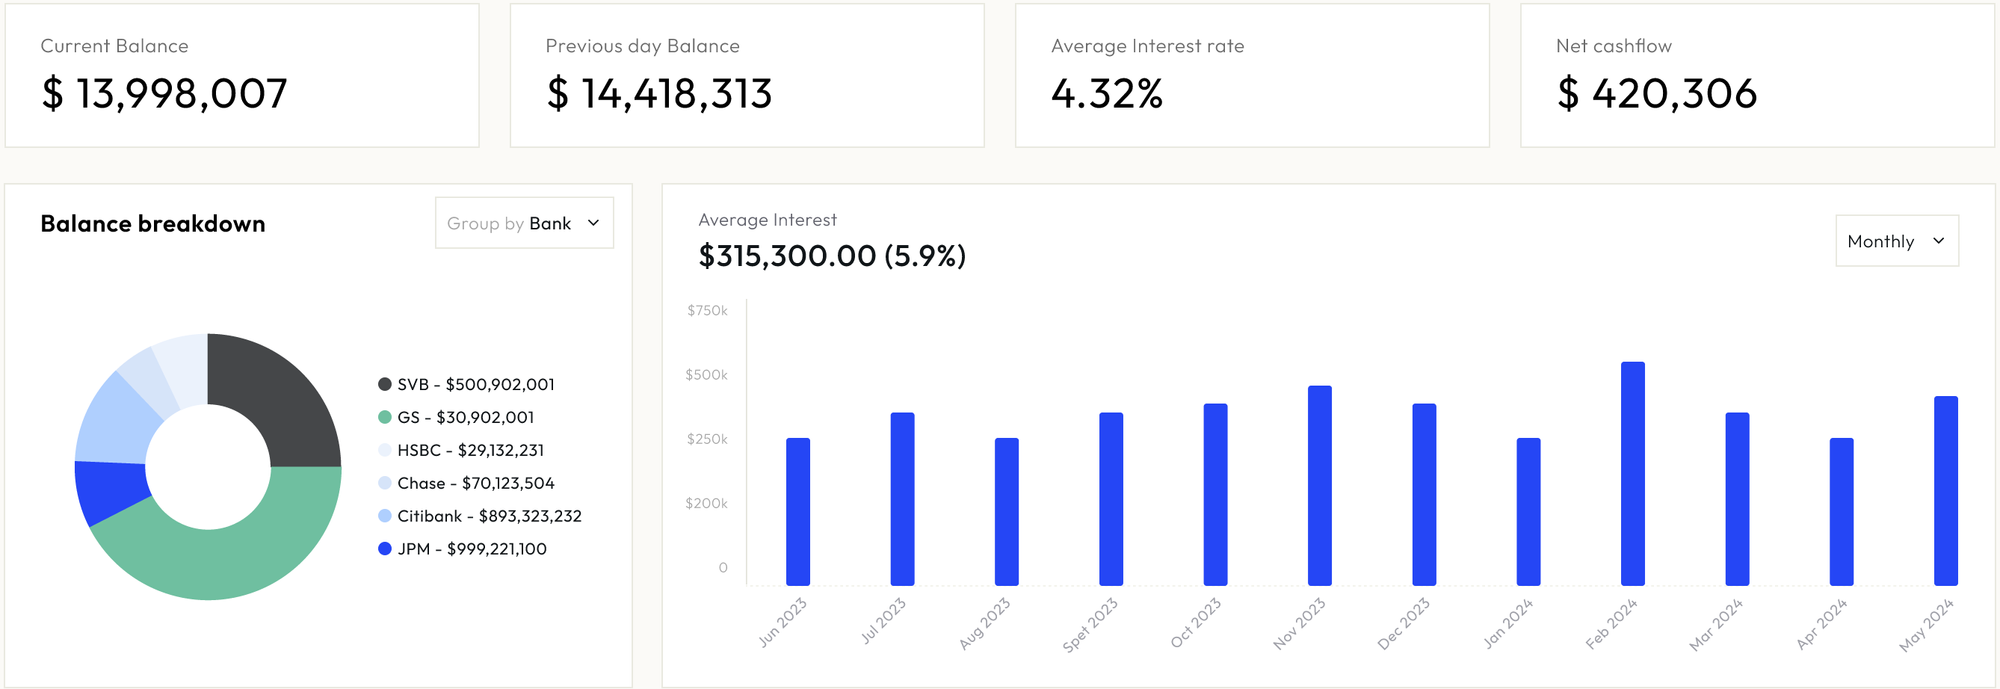
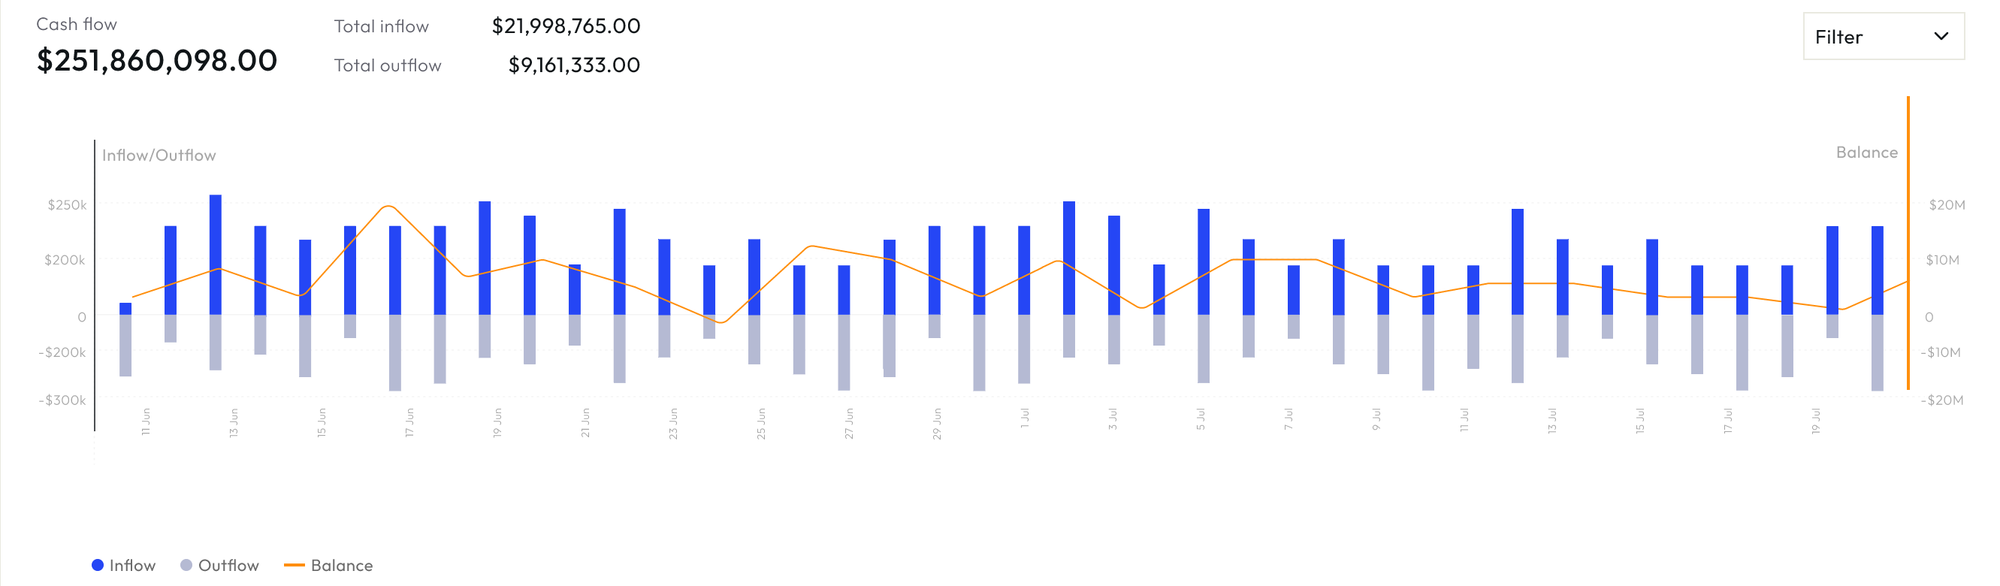
What it looked like?
Challenges with v1
While our initial approach seemed logical, we soon encountered several issues:
Recognizing the limitations of our initial implementation, we identified key areas that needed improvement:
To address these challenges, we explored several OLAP solutions.
| Databricks | BigQuery | ClickHouse | |
|---|---|---|---|
| Bulk insertions | Yes | Yes | Yes |
| Low-latency queries | No | No | Yes - great at real-time aggregations |
| Real-time updates | No - latent because of suboptimal autoloader | Yes - direct CDC from Spanner | Yes |
| Materialized views | Yes - but have to build data pipelines manually. | Yes, but with limitations | Yes |
ClickHouse is an OLAP database, very good at insertions, low-latency queries and supports materialized views to precompute aggregations.
Materialized Views
Materialized Views in ClickHouse allow us to precompute and store aggregated data efficiently. This feature is crucial for our real-time analytics needs:
Engines
ClickHouse provides various table engines optimized for different use cases, allowing us to fine-tune our data storage and query performance:
Our operational database, Google Cloud Spanner, continued to serve all of our business needs, especially for OLTP scenarios. Spanner's strong consistency model and global distribution capabilities made it ideal for handling our day-to-day transactional workloads.
To leverage ClickHouse's analytical prowess, we needed to move data from Spanner to ClickHouse. We implemented this using a Change Data Capture (CDC) approach:
This approach allowed us to maintain an up-to-date copy of our operational data in ClickHouse, ready for complex analytical queries.
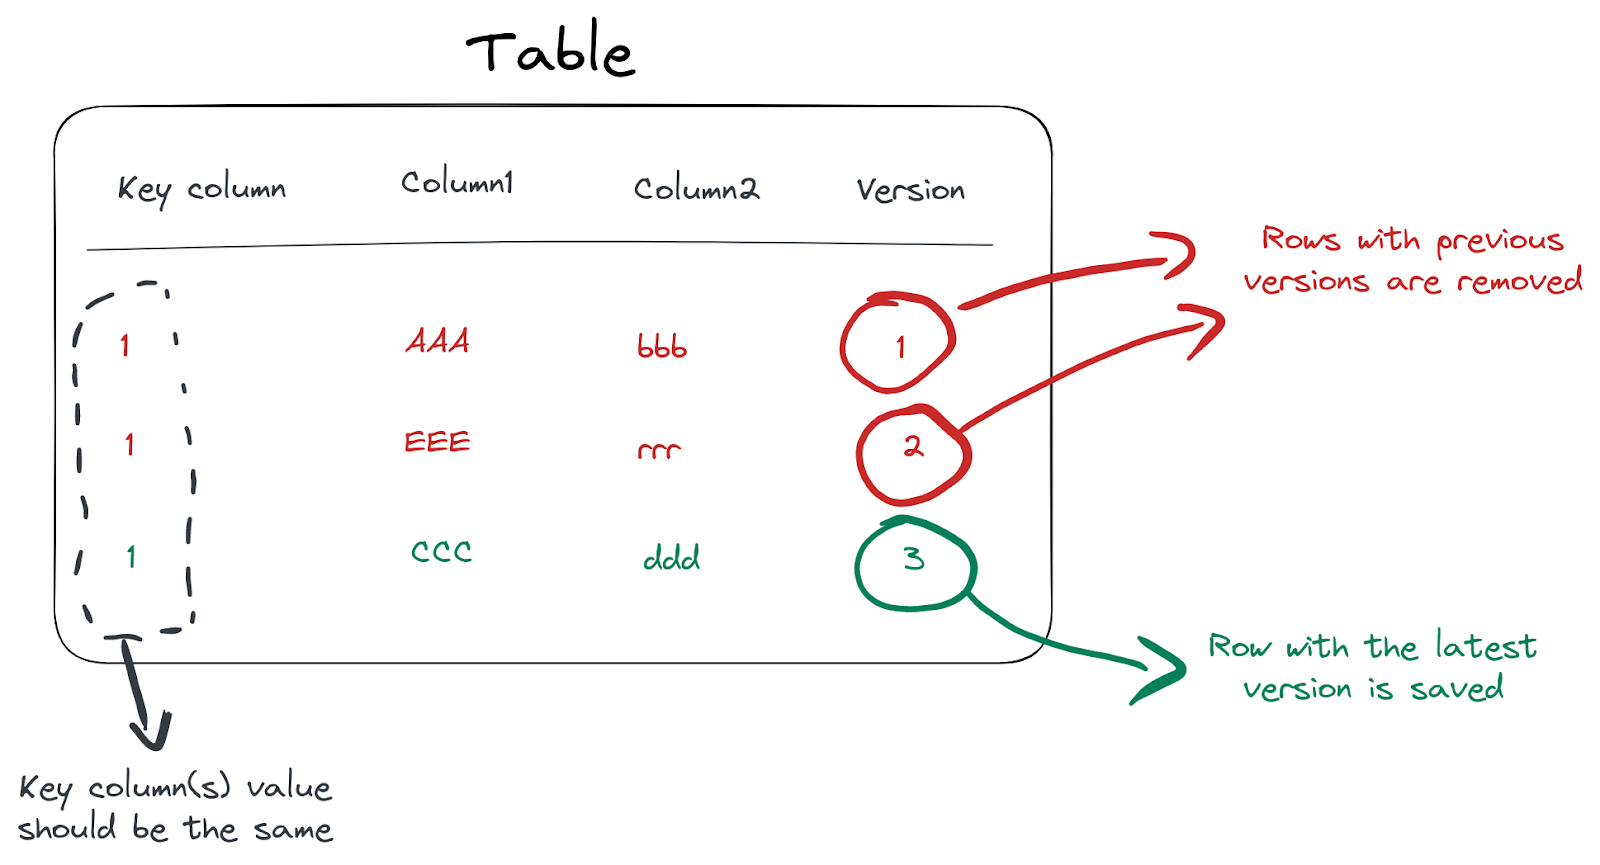
However, this approach came with its own set of challenges, primarily due to a limitation in ClickHouse. An MV can be good at only one thing - deduplication (ReplacingMergeTree) or aggregation (SummingMergeTree), but not both.
In our scenario, updates on a row would trigger a new entry in our CDC and a corresponding insertion into ClickHouse. This would have to go and replace the old r0w with the "new value".
Addressing this challenge: Lambda architecture
While ClickHouse proved to be an excellent solution for our analytics needs, implementing it within our existing infrastructure presented its own set of challenges. We adopted a Lambda architecture to bridge the gap between our operational needs and analytical capabilities. Here's a deeper look at our implementation.
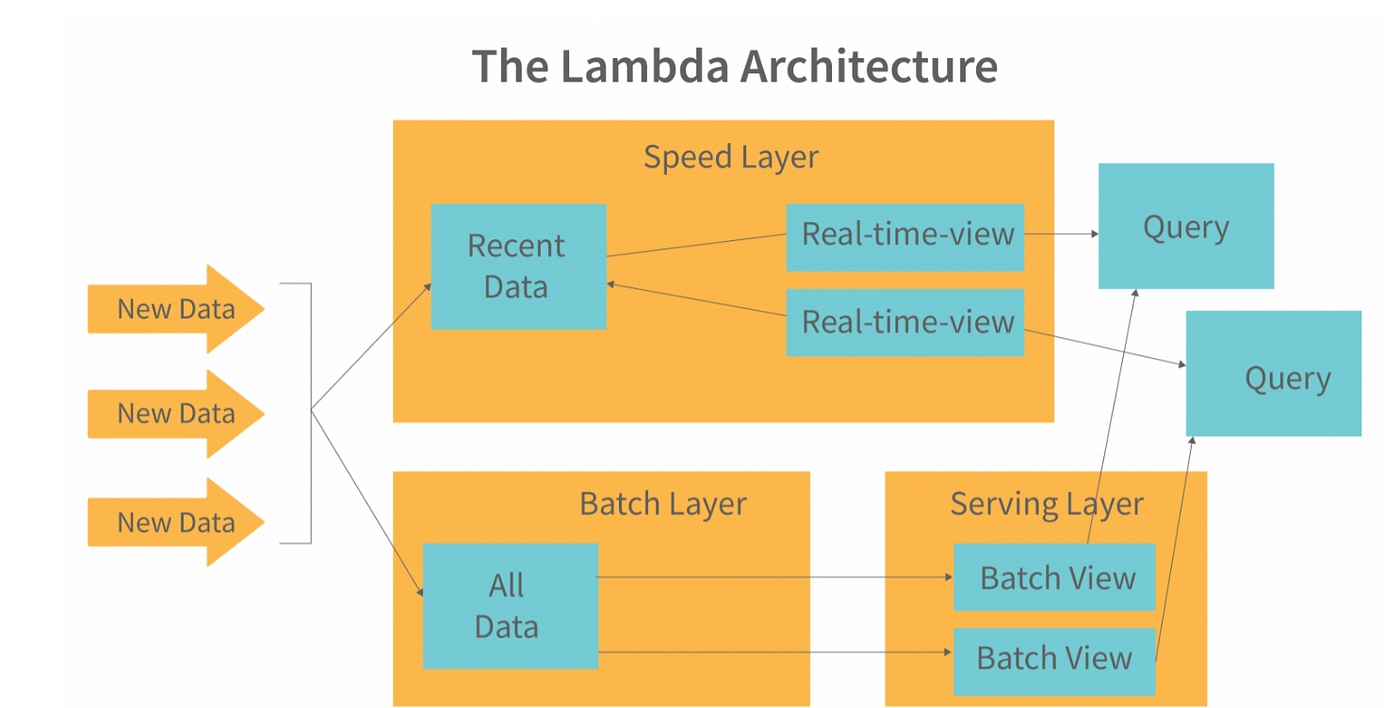
We went with the Lambda Architecture because it gave us the best of both worlds: accuracy and speed. For real-time analytics, we needed a system that could process incoming events instantly while still providing consistent and reliable historical data.
The streaming layer ensures that our analytics stay as real-time as possible, handling millions of transactions as they come in. Meanwhile, the batch layer serves as the source of truth, running comprehensive computations on historical data to maintain accuracy and consistency.
By combining these two layers, we could deliver low-latency insights without compromising on data integrity—perfect for treasurers who need to make decisions backed by solid analytics. It wasn’t just about speed; it was about speed and accuracy of the values.
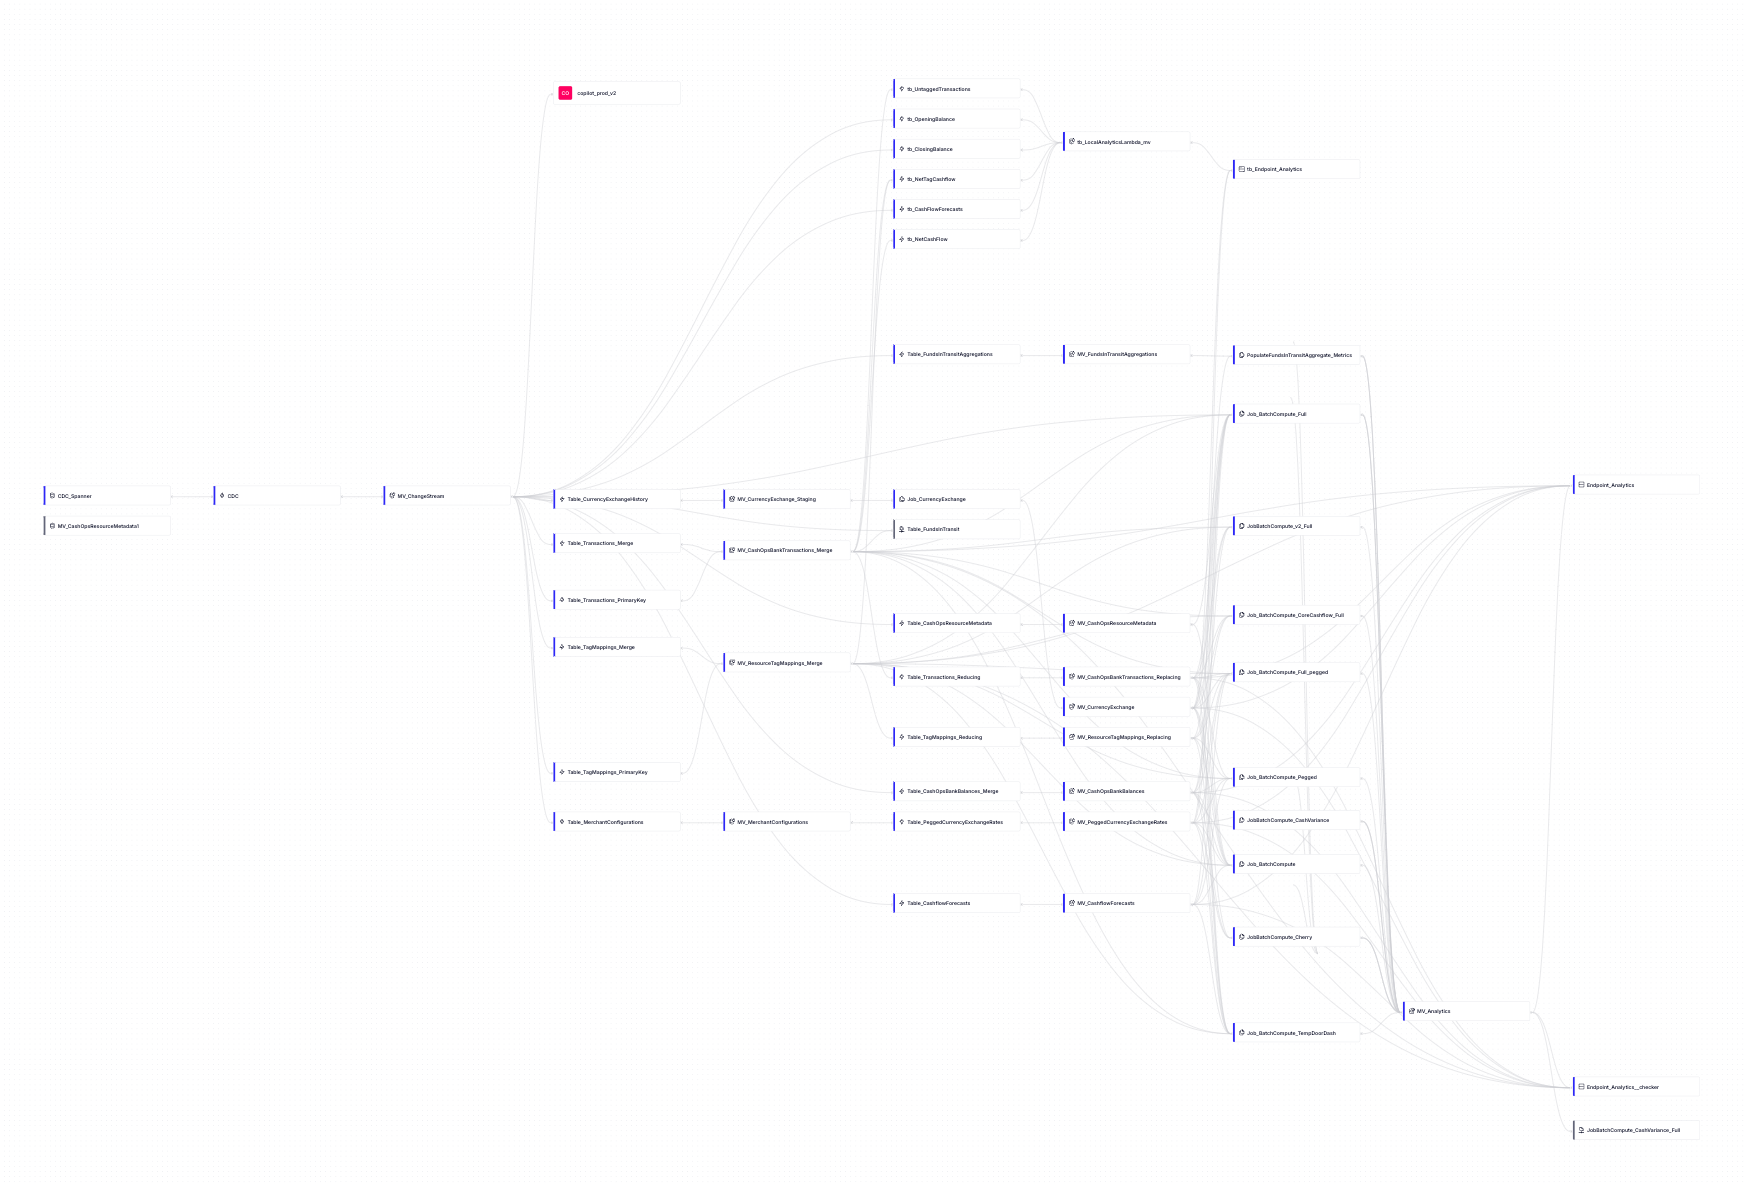
In this way we eliminated the need for aggregations
Our pipeline is complex, but necessary for our use case.
Our journey from a naive implementation to a specialized, ClickHouse-based solution has significantly improved our analytics capabilities. We now have a robust, scalable, and real-time analytics platform that can handle the diverse needs of our users.
But our work isn't done. We continue to refine and optimize our analytics module. We're working on something that makes this module more customizable and implementing several AI features like prompt-based responses etc.
If you're interested in solving really difficult technical challenges - we're hiring. Please reach out to us at careers@zamp.finance or apply here.
Giridhar Balachandran, Engineering, Zamp.